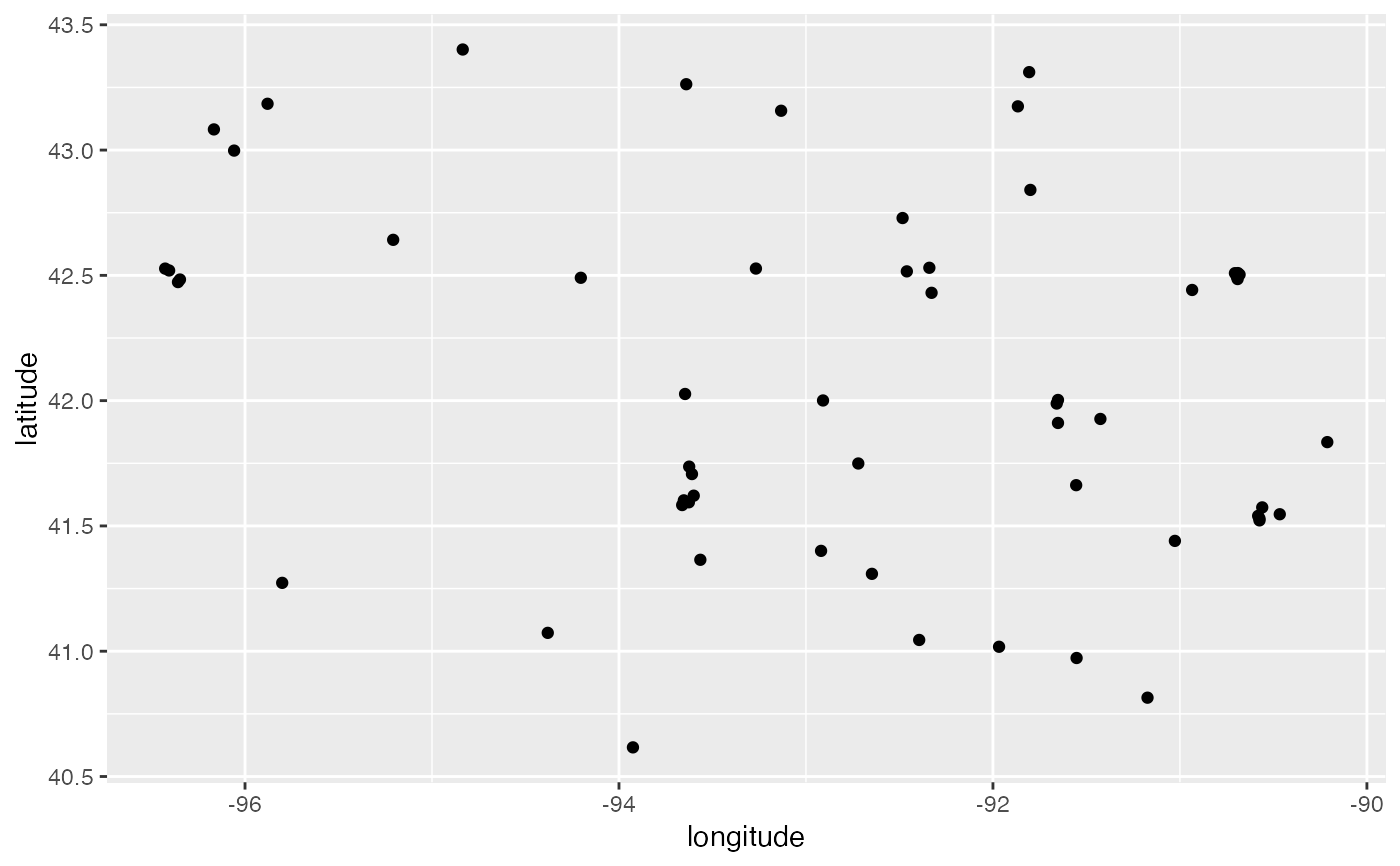
Location of colleges and universities in Iowa
colleges.RdDataset was scraped by Masoud Nosrati from wikipedia in Mar 2020, geocoding by Heike Hofmann through Google API.
colleges
Format
A data frame with 57 rows and 11 variables:
- name
name of school
- city
name of the clinic
- type
type of institution by degree
- enrolment
number of students enrolled (in Spring 2012)
- address
address used in search string for Google geocoding
- latitude
geographic latitude
- longitude
geographic longitude
- classification
column used for classifying the data set
Source
https://en.wikipedia.org/wiki/List_of_colleges_and_universities_in_Iowa
Examples
# Map of rural health clinics in Iowa using ggplot2 library(ggplot2) library(dplyr) # for the pipe colleges %>% ggplot() + geom_point(aes(x = longitude, y = latitude))# leaflet map library(leaflet) library(sf) colleges %>% leaflet() %>% addTiles() %>% addPolygons(data = ia_counties, weight = 1, color="#333333") %>% addCircleMarkers(lng = ~longitude, lat = ~latitude, radius = 1, stroke = 0.1, label = ~name)