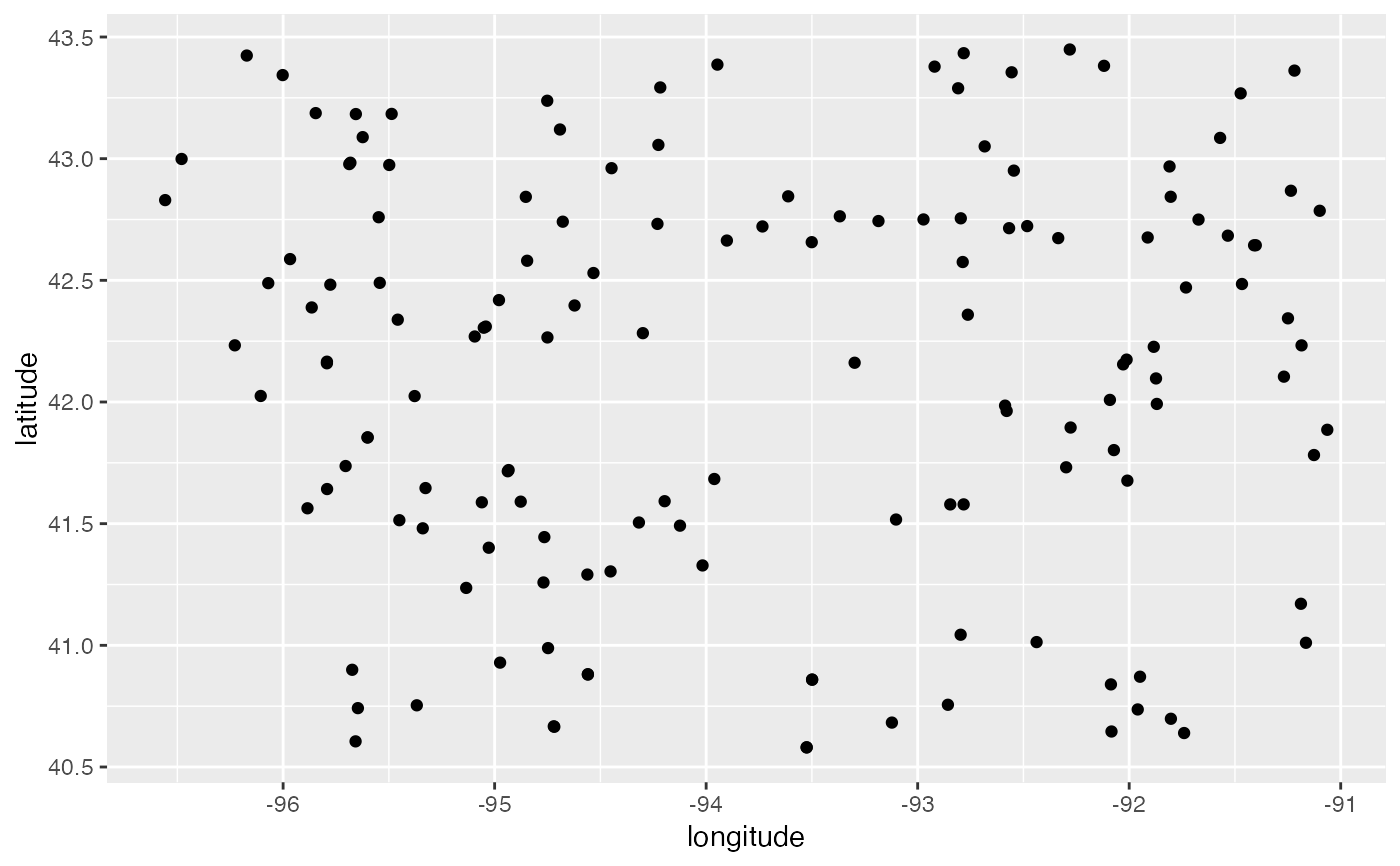
Location of rural health clinics in Iowa
health.clinics.RdDataset was scraped by Masoud Nosrati from the Iowa Association of Rural Health Clinics in Mar 2020, geocoding by Andrew Maloney through QGIS.
health.clinics
Format
A data frame with 146 rows and 11 variables:
- name
name of the clinic
- address
formatted addresses - some are duplicates - XXX look into
- state
state abbreviation
- county
name of the county
- zip
zip code
- country
country where facility is located
- result_num
146 0s XXX delete column?
- status
146 OKs XXX delete column?
- longitude
geographic longitude
- latitude
geographic latitude
- classification
column used for classifying the data set
Source
https://iarhc.org/find-a-rural-health-clinic?view=map
Examples
# Map of rural health clinics in Iowa using ggplot2 library(ggplot2) library(dplyr) # for the pipe health.clinics %>% ggplot() + geom_point(aes(x = longitude, y = latitude))# leaflet map library(leaflet) library(sf) health.clinics %>% leaflet() %>% addTiles() %>% addPolygons(data = ia_counties, weight = 1, color="#333333") %>% addCircleMarkers(lng = ~longitude, lat = ~latitude, radius = 1, stroke = 0.1, label = ~name)