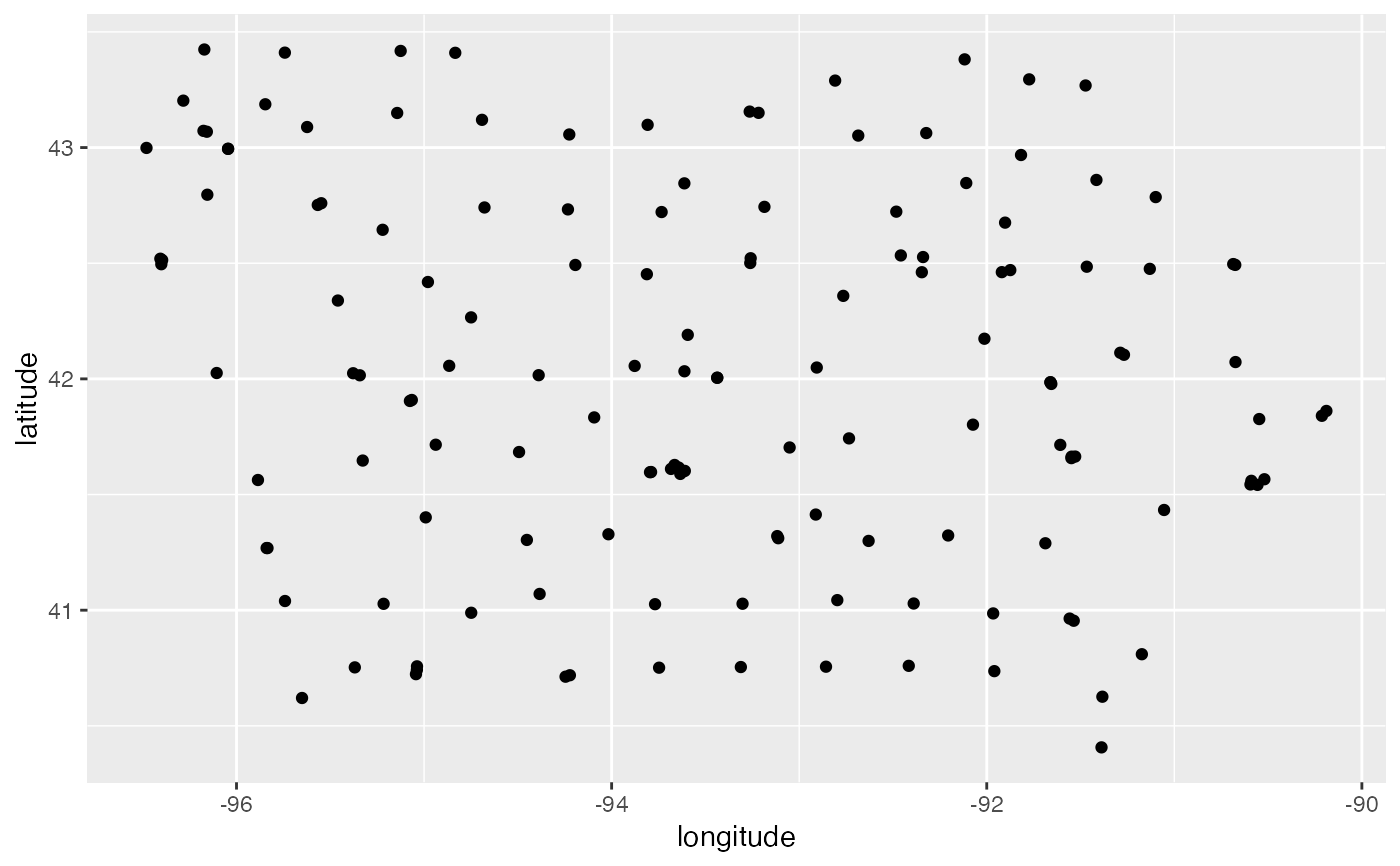
Location of hospitals in Iowa
hospitals.RdDataset was scraped by Masoud Nosrati from Official USA in Mar 2020, geocoding by Andrew Maloney through QGIS.
hospitals
Format
A data frame with 145 rows and 15 variables:
- city
name of the city
- name
name of the hospital - XXX rename to NAME
- type
type of hospital, one of 'critical access', 'general acute care', 'psychiatric', 'long term care', and 'military'
- website
url if available
- beds
number of BEDS
- naics_desc
North American Industry Classification System (NAICS) descriptor: 'general medical and surgical hospital' or 'specialty hospital'
- result_num
145 0s XXX delete column?
- status
145 OKs XXX delete column?
- address
formatted addresses - some are duplicates - XXX look into
- state
state abbreviation
- zip
zip code
- latitude
geographic latitude
- longitude
geographic longitude
- classification
column used to classify the data set
Source
https://www.officialusa.com/stateguides/health/hospitals/iowa.html
Examples
# Map of hospitals in Iowa using ggplot2 library(ggplot2) library(dplyr) # for the pipe hospitals %>% ggplot() + geom_point(aes(x = longitude, y = latitude))# leaflet map library(leaflet) library(sf) hospitals %>% leaflet() %>% addTiles() %>% addPolygons(data = ia_counties, weight = 1, color="#333333") %>% addCircleMarkers(lng = ~longitude, lat = ~latitude, radius = 1, stroke = 0.1, label = ~name, clusterOptions = markerClusterOptions())