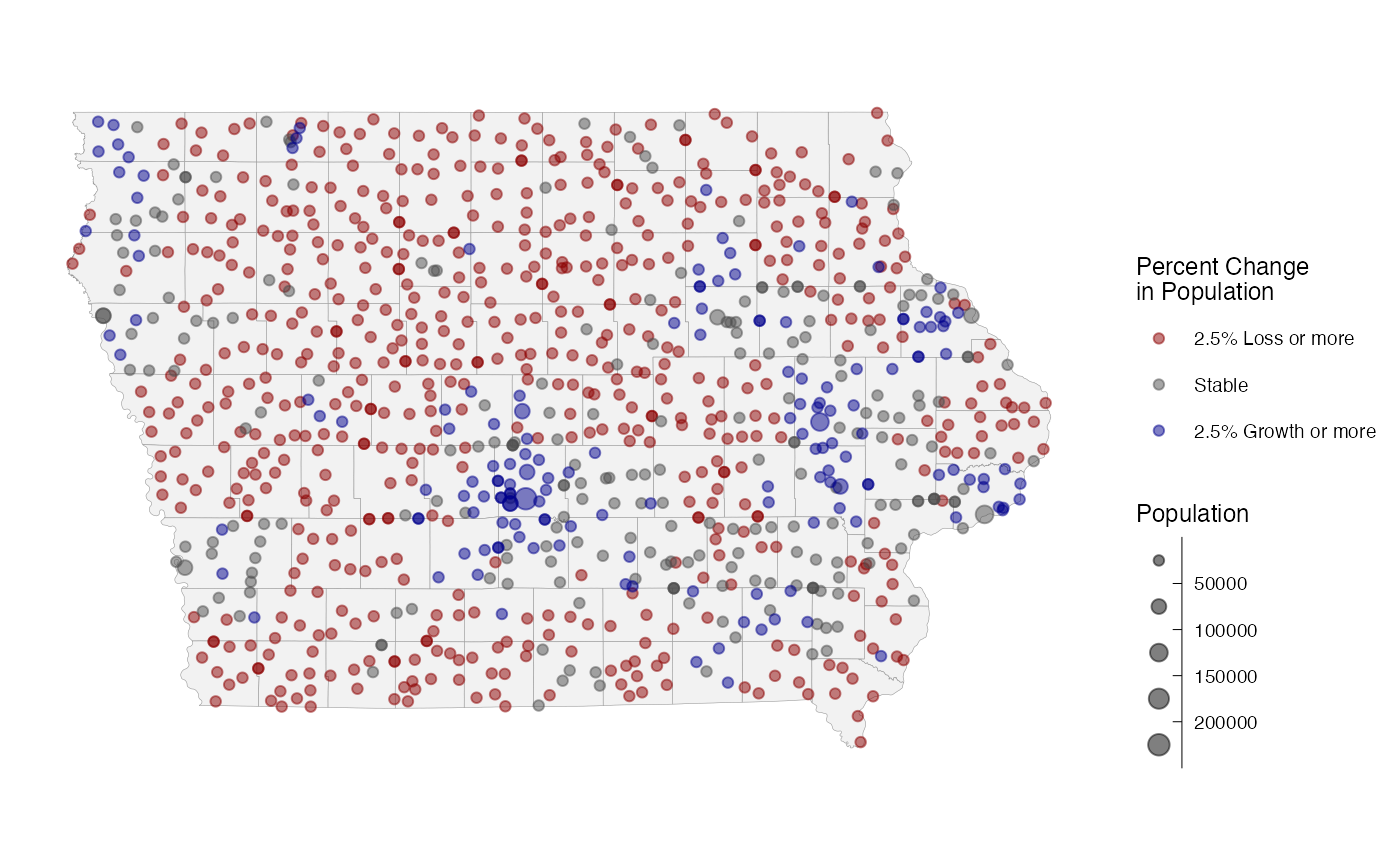
Location of Iowa's cities
ia_cities.Rdprovenance - Chris, I need some help with how we document these exports.
ia_cities
Format
A data frame with 1069 rows and 17 variables:
- rid
rid number
- city
city name
- cityFIPS
5-digit city fips code
- cityFIPS_1
7-digit city fips code
- county
county name
- countyPr
categorical: 60 0s and 1009 xs.
- countyPr_1
categorical: 56 0s and 1013 xs.
- countyFI
double value - maybe an identifier?
- countyFI_1
looks like FI with an additional 19 in front
- stateNam
state name - constant value of `Iowa`.
- stateFIP
state fips code - constant value of 19.
- state
two-letter state abbreviation - constant value of `IA`
- type
categorical variable: 1001 0s, one oopsie that probably should be a zero. 59 CDPs 1 other and 7 unincorporated communities.
- popChange
sf point object - absolute change in population between XXX and XXX?
- currentPop
sf point object - current population (what is the basis for these numbers?)
- percentChg
sf point object - percent change in population.
- geometry
sf point object of IA cities' coordinates.
Source
Examples
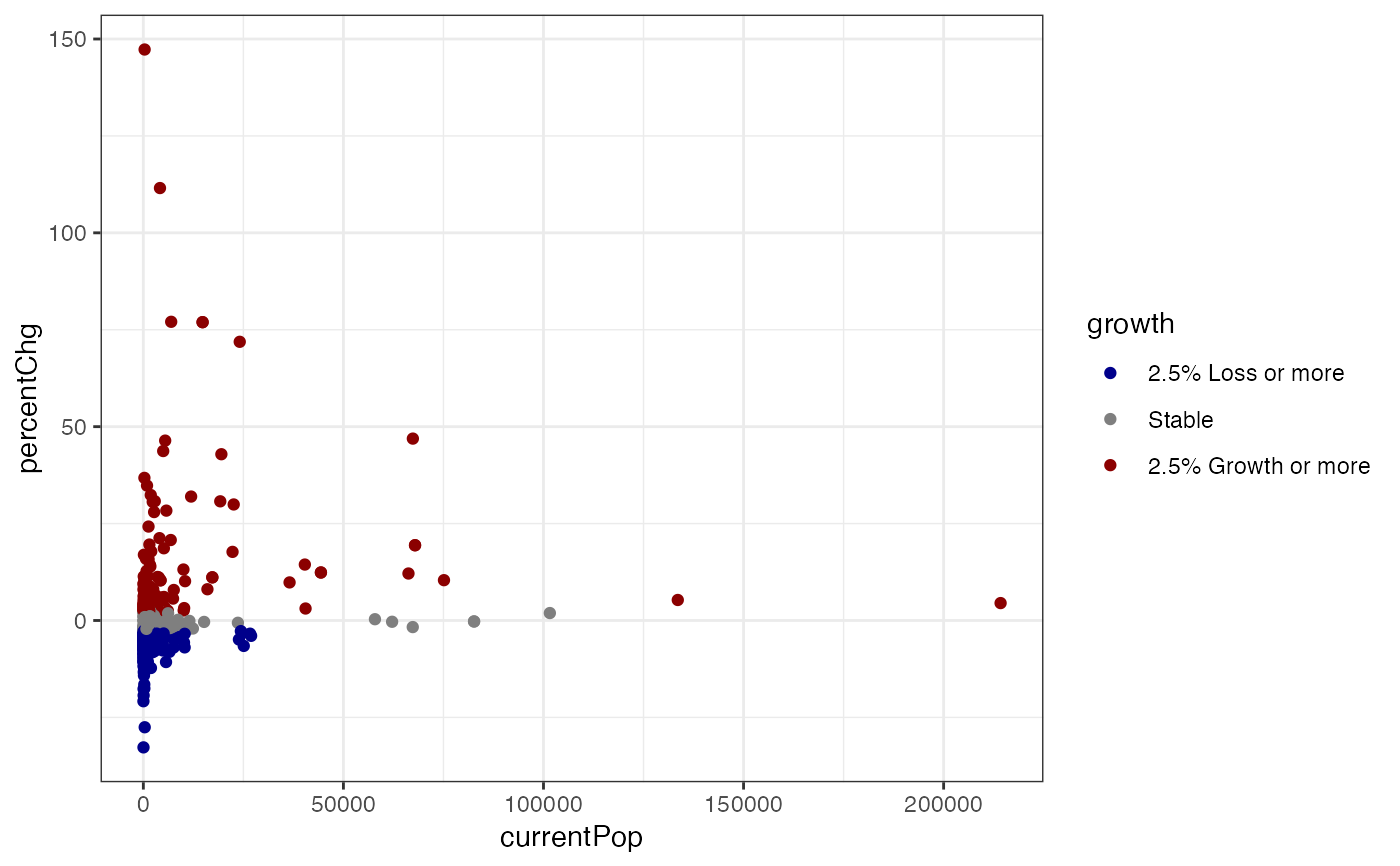
# county map of iowa in ggplot2 library(ggplot2) library(dplyr) # for the pipe ia_cities %>% mutate( growth = cut(percentChg, breaks = c(-Inf, -2.5, 2.5, Inf), labels = c("2.5% Loss or more", "Stable", "2.5% Growth or more"))) %>% filter(!is.na(growth)) %>% ggplot() + geom_sf(data = ia_counties, fill="grey95", colour = "grey60", size = 0.1) + geom_sf(aes(size = currentPop, colour = growth), alpha = 0.5) + scale_size_binned("Population", range=c(0.5,3.5)) + scale_colour_manual("Percent Change\nin Population", values=c("darkred", "grey30", "darkblue")) + ggthemes::theme_map() + theme(legend.position = "right")# leaflet map library(leaflet) library(sf) colors <- c("darkred", "grey30", "darkblue") labels <- c("2.5% Loss or more", "Stable", "2.5% Growth or more") pal <- colorFactor(palette = colors, levels = labels) ia_cities %>% mutate( growth = cut(percentChg, breaks = c(-Inf, -2.5, 2.5, Inf), labels = labels)) %>% leaflet() %>% addTiles() %>% addPolygons(data = ia_counties, weight = 1, color="#333333") %>% addCircleMarkers(radius = ~log(currentPop, base=2), color = ~pal(growth), label = ~city) %>% addLegend(title = "% Change in Population", colors = colors, labels = labels) ia_cities %>% filter(!is.na(currentPop)) %>% mutate( growth = cut(percentChg, breaks = c(-Inf, -2.5, 2.5, Inf), labels = labels)) %>% ggplot(aes(x = currentPop, y = percentChg)) + geom_point(aes(color = growth)) + scale_colour_manual(values = c("darkblue", "grey50", "darkred")) + theme_bw()