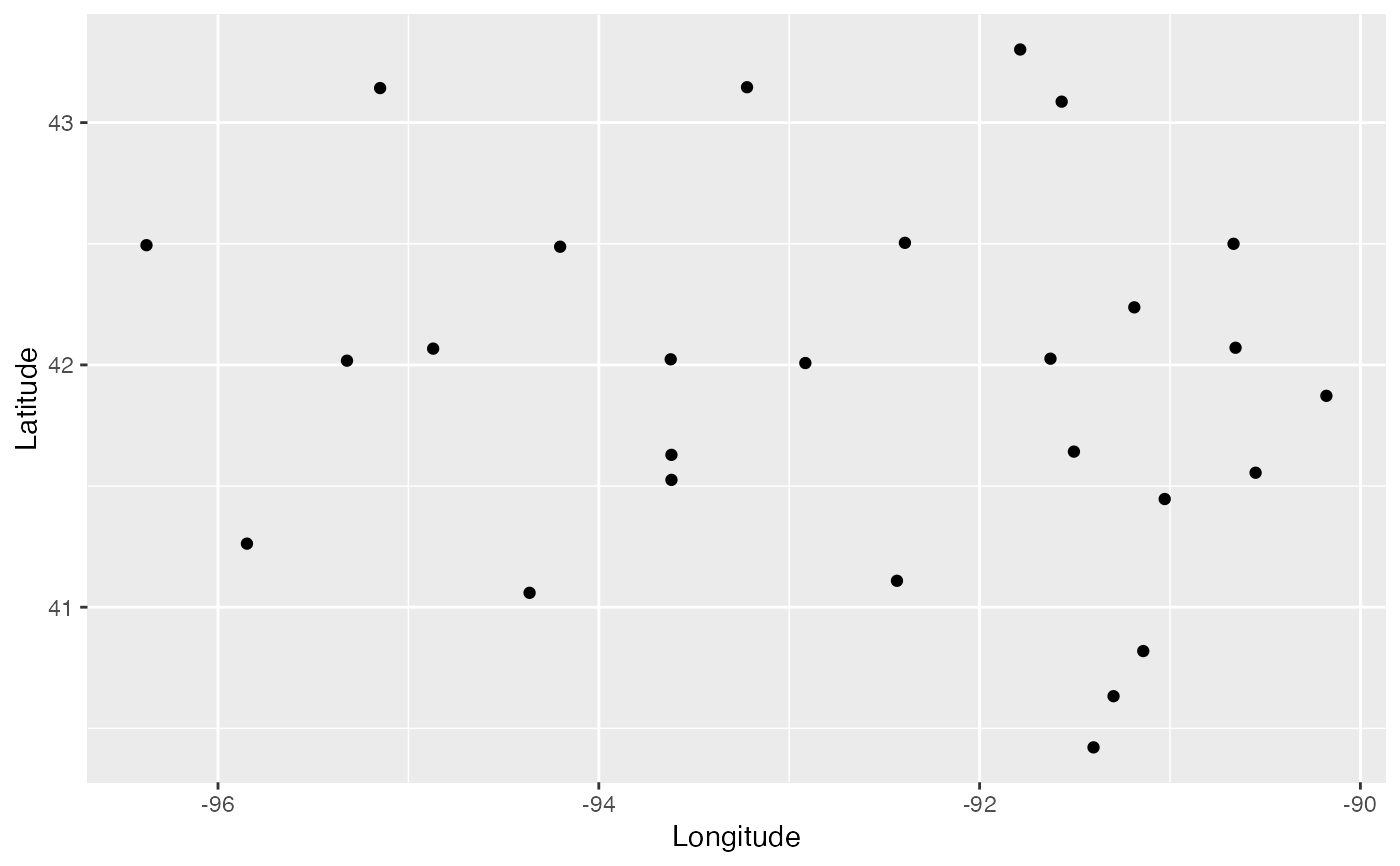
Location of IowaWORKS Centers in Iowa
iowaworks.RdDataset was scraped by Masoud Nosrati from the Iowa Workforce Development in Mar 2020, geocoding by Andrew Maloney through QGIS.
iowaworks
Format
A data frame with 27 rows and 18 variables:
- ID
identifier, not quite the row number
- NAME
enumeration of counties the center serves
- TYPE
Center - XXX delete
- STREET
street address
- CITY
city
- STATE
state
- ZIP
5-digit zip code
- PHONE
phone number
email address
- AREA
NAs - XXX delete
- LINK
weblink to the center
- result_num
0s XXX delete column?
- status
OKs XXX delete column?
- formatted_
formatted addresses - some are duplicates - XXX look into
- place_id
identifier, based on address? - some are duplicates - XXX look into
- location_t
categorical variable with additional details on location.
- Latitude
geographic latitude
- Longitude
geographic longitude
Source
https://www.iowaworkforcedevelopment.gov/contact
Examples
# Map of centers in Iowa using ggplot2 library(ggplot2) library(dplyr) # for the pipe iowaworks %>% ggplot() + geom_point(aes(x = Longitude, y = Latitude))# leaflet map library(leaflet) library(sf) iowaworks %>% group_by(NAME, PHONE) %>% mutate( hovertext = htmltools::HTML(paste0("IowaWORKS Center<br>",formatted_, '<br>serving ', NAME, '<br>', PHONE)) ) %>% leaflet() %>% addTiles() %>% addPolygons(data = ia_counties, weight = 1, color="#333333") %>% addCircleMarkers(lng = ~Longitude, lat = ~Latitude, radius = 1, stroke = 0.1, label = ~hovertext)