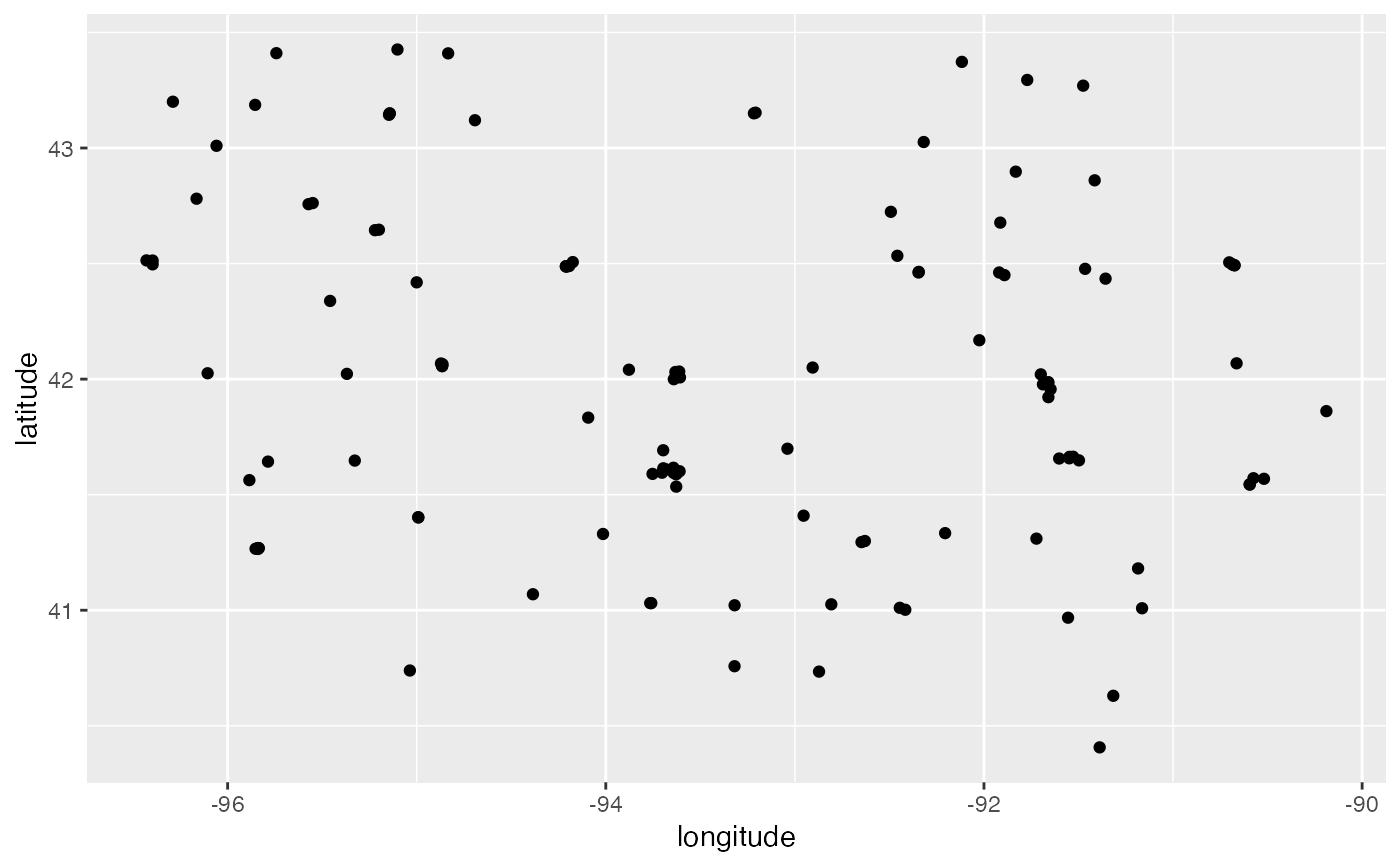
Location of Licensed Substance Use Disorder/Problem Gambling Programs in Iowa
sud.RdDataset was scraped by Masoud Nosrati from the Iowa Department of Public Health Development in Mar 2020, geocoding by Andrew Maloney through QGIS.
sud
Format
A data frame with 123 rows and 15 variables:
- name
name of the facility
- phone
phone number
- street
street address
- city
city
- statename
name of state
- zip
5-digit zip code
- result_num
0s XXX delete column?
- status
OKs XXX delete column?
- address
formatted addresses - some are duplicates - XXX look into
- latitude
geographic latitude
- longitude
geographic longitude
- state
state abbreviation
- classification
column used to classify the dataset
Source
Examples
# Map of centers in Iowa using ggplot2 library(ggplot2) library(dplyr) # for the pipe sud %>% ggplot() + geom_point(aes(x = longitude, y = latitude))# leaflet map library(leaflet) library(sf) sud %>% group_by(name,address, phone) %>% mutate( hovertext = htmltools::HTML(paste0(name, "<br>",address, '<br>', phone)) ) %>% leaflet() %>% addTiles() %>% addPolygons(data = ia_counties, weight = 1, color="#333333") %>% addCircleMarkers(lng = ~longitude, lat = ~latitude, radius = 1, stroke = 0.1, label = ~hovertext)